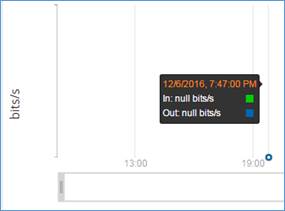
Thanks Morten. I am sorry but my english is not so good, so I try to explain better my request. I already know where I can retrieve the port activity graphs. My problem is these graphs are empty, there is no value. Do I have to configure something to enable the collection of the value and thus having graphs ? Here is what I get (whatever the device) : [cid:image001.jpg@01D25069.0BC69EC0] -----Original Message----- From: Morten Brekkevold [mailto:morten.brekkevold@uninett.no] Sent: mercoledì 7 dicembre 2016 08:59 To: Orzakiewicz Cedric <cedric.orzakiewicz@barilla.com> Cc: nav-users@uninett.no Subject: Re: NAV : add port activity graphs On Tue, 6 Dec 2016 15:06:48 +0000 Orzakiewicz Cedric <cedric.orzakiewicz@barilla.com<mailto:cedric.orzakiewicz@barilla.com>> wrote:
Can anyone explain how to get activity graph of a switch port in NAV 4.6.0 ?
Same page as before, only now it is located on the tab labeled "Activity graphs". -- Morten Brekkevold UNINETT